American Markets –US LargeCap Report
Rankings are segmented into several major categories designed to assist the investor in focusing on a global, regional, country, sector or individual stock. This report will provide insight on the US LargeCap. For complete details on the US LargeCap individual stock rankings please reference the data on our site, www.investment-strategy.info. (MENU: Client Service > Rankings > Americas > US Lcap – Composite) The Rankings: American Markets – US LargeCap Report will be posted monthly. Mid-month postings may occur between monthly reports if there is a meaningful change in the overall ranking positions.
Rankings are derived using six fundamentally important factors that create a profile for each company. The profile is unique in that it can be used to rank a stock or market from any part of the world to any other stock or market. The six factors used to create the ranking are:
- Sales growth
- Earnings Per Share
- Dividend growth
- Price Earnings Ratio
- Yield
- Price Earnings Growth
Additional qualifying measures of data reliability are applied to the six factors. Sales growth, EPS and dividends reliability is measured over several time periods and applied to create a qualified sales growth, EPS and dividend growth value. The PEG factor is measured on a median basis rather than an average, avoiding heavily skewed ranking distortions.
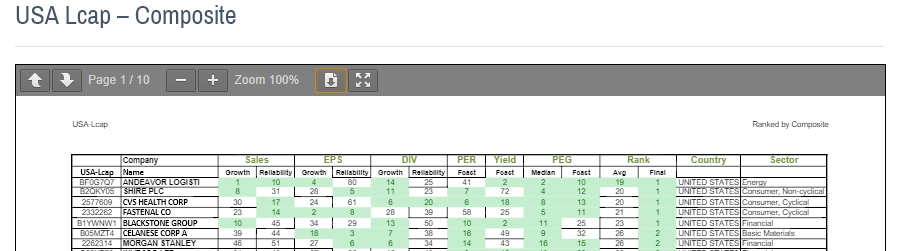
The six qualified factors are then used to determine an overall ranking and reported as the US LargeCap. A sample of the ranking report is shown in Figure 1. The stocks are ranked using the six factors mentioned earlier from 1 to 100. The rankings fall into deciles. The first decile is the most desirous and the tenth decile, the least promising.
Within the market are ten sectors that cover the globe: Basic Materials, Communications, Consumer Cyclical, Consumer Non-cyclical, Diversified, Energy, Financial, Industrial, Technology and Utilities. Figure 2 is a pie chart showing the representation of each sector.
These sectors can be applied across all markets. We use them because some sector designations that are used in the industry, can only be applied on a local market or country basis. The 10 sector designations used in the rankings can be applied across all global markets equally.
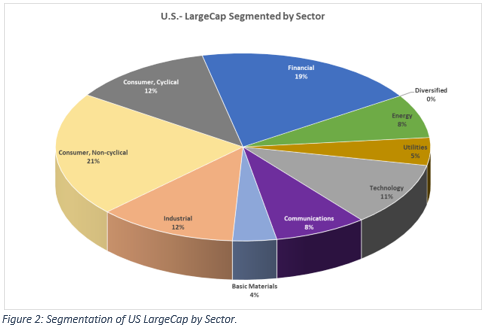
Within the U.S., Consumer Non-cyclical is the largest sector at 21%. Financials are next at 19%, followed by Consumer Cyclical and Industrial at 12% each. Technology follows closely at 11% with Communications and Energy at 8%.
It is always interesting to see how close the most desirable decile stocks (1st & 2nd) within a market, mirror the overall market distribution. Or, are certain sectors more favorable? At this point in time, Consumer cyclical stocks represent the largest favorable position at 21% followed by Financials and Consumer non-cyclical at 17% each. (See Figure 3).
In comparing the current level of 1st and 2nd stocks in each sector with overall sector weightings, we find there are higher weights for 1st and 2nd decile stocks in Consumer cyclicals, Financials and Basic Materials.
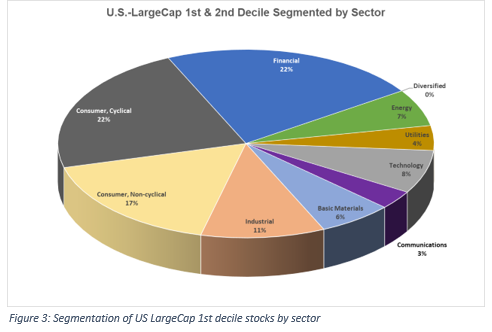
There are lower weights for Consumer non-cyclicals, Technology and Communications.
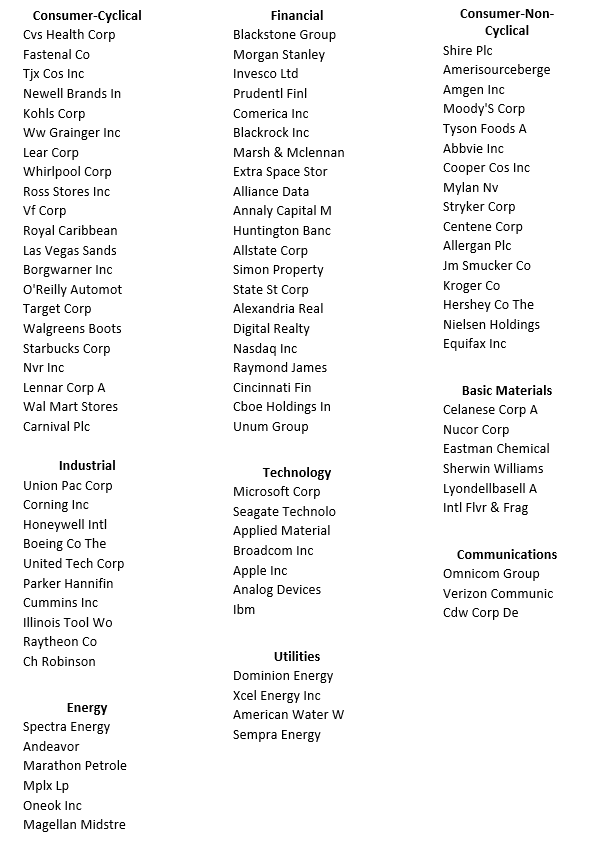
The stocks that rank 1st or 2nd for each sector are shown in the following tables. There are 94 stocks awarded a 1st or 2nd decile ranking:
22 Financials
22 Consumer cyclicals
17 Consumer non-cyclical
10 Industrial
7 Technology
6 Basic Materials
6 Energy
4 Utilities
3 Communications