U.K. Financial stocks represent 25% of 1st decile stocks but hold a 28% overall market weight. Energy does not have any representation in the 1st decile segmentation.
Rankings are segmented into several major categories designed to assist the investor in focusing on a global, regional, country, sector or individual stock. This report will provide insight on the UK LargeCap. For complete details on the UK LargeCap individual stock rankings please reference the data on our site, www.investment-strategy.info. (MENU: Client Service > Rankings > Europe > UK LargeCap – Composite) The Rankings: European Markets – UK LargeCap Report will be posted monthly. Mid-month postings may occur between monthly reports if there is a meaningful change in the overall ranking positions.
Rankings are derived using six fundamentally important factors that create a profile for each company. The profile is unique in that it can be used to rank a stock or market from any part of the world to any other stock or market. The six factors used to create the ranking are:
- Sales growth
- Earnings Per Share
- Dividend growth
- Price Earnings Ratio
- Yield
- Price Earnings Growth
Additional qualifying measures of data reliability are applied to the six factors. Sales growth, EPS and dividends reliability is measured over several time periods and applied to create a qualified sales growth, EPS and dividend growth value. The PEG factor is measured on a median basis rather than an average, avoiding heavily skewed ranking distortions.
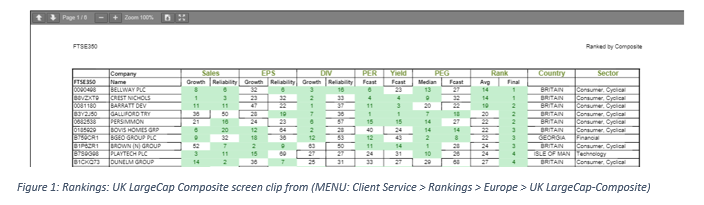
The six qualified factors are then used to determine an overall ranking and reported as the UK LargeCap. A sample of the ranking report is shown in Figure 1. The stocks are ranked using the six factors mentioned earlier from 1 to 100. The rankings fall into deciles. The first decile is the most desirous and the tenth decile, the least promising.
Within the market are ten sectors that cover the globe: Basic Materials, Communications, Consumer Cyclical, Consumer Non-cyclical, Diversified, Energy, Financial, Industrial, Technology and Utilities. Figure 2 is a pie chart showing the representation of each sector.
.
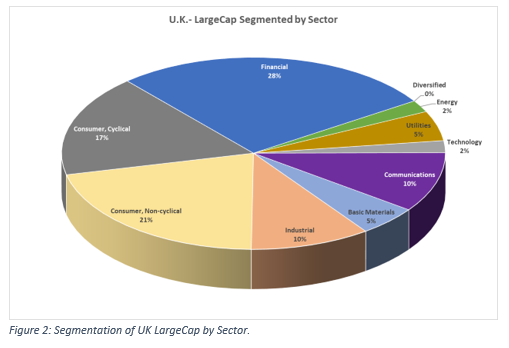
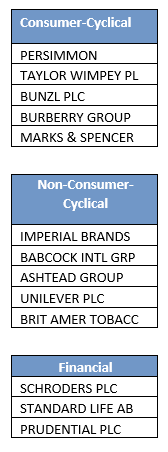
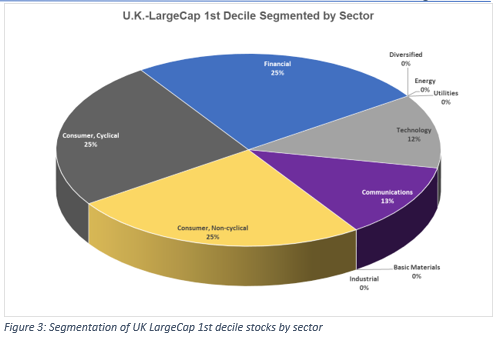
It is always interesting to see if the 1st decile stocks within a market mirror the overall market distribution or does one sector become favored. At this point in time, within the 1st decile ranking, Consumer stocks represent the dominate position at 50% followed by Financials at 25% (See Figure 3). Consumer based stocks are equally weighted between Non-cyclical and Cyclical. This sector has a dominate position at this point in determining overall performance.
Financial stocks represent 25% of 1st decile stocks but hold a 28% overall market weight. Energy does not have any representation in the 1st decile segmentation.
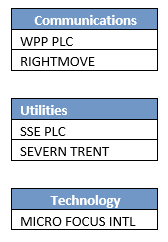
The stocks that rank at least a 1st or 2nd for each sector are shown in the following tables. There are 18 stocks awarded a 1st or 2nd decile ranking: 5 are in Consumer Cyclicals, 5 more in Consumer Non-cyclicals, 3 in Financials, 2 each in Communications and Utilities with 1 in Technology.