
Since Investment Strategy Network started in the mid-1980’s, research on the relationship that exists between individual stocks, markets, sectors and each other has been ongoing. As part of the expanding ISN service, we are now providing information about the degree of influence that exists between individual U.S. stocks and the respective market (LargeCap, MidCap, SmallCap) and the individual stock’s respective sector (Consumer Discretionary, Energy, etc., etc.).
Today we are starting to show the influence that exists with both the market and sector on each individual stock analysis sheet. Please see the circled portion of the analysis table below.
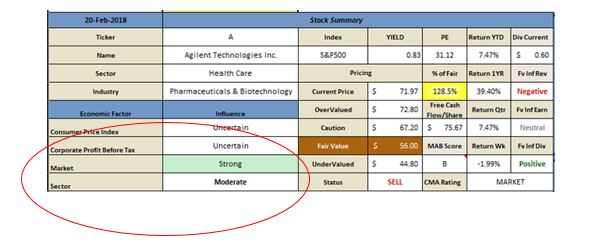
Each market and sector factor’s influence has been classified into one of five categories: Very Strong, Strong, Moderate, Uncertain and Inverse. The classifications are self-explanatory but, to provide some guidance classification in a Very Strong category requires a high ISN-Factor score of > 90, and between 80 and 90 to receive a classification of Strong. Even the Moderate classification suggests an investor might wish to take note of the relationship. The Moderate classification has an ISN-Factor score of between 70 and 80. The classification of Uncertain is used for any relationship that hold an ISN-Factor score of under 70. The Inverse rating is reserved for any relationship that demonstrates a consistent reverse or opposite relationship with the stock being examined.
The relationship identified as “Market” is the stocks relationship to the stocks specific market. A LargeCap stock is compared to the LargeCap market constituents. The same is true for MidCap and SmallCap stocks. The sector relationship is also compared to the individual stock’s sector. Energy stocks are compared to other energy stocks.
Very Strong and Strong relationships will have a green tint to the cell where the rating is identified. Inverse relationships are marked in red.