We expect the DJIA to reach 25,892 by the end of 2018 and perform slightly below the long-term average. The forecast range for the DJIA is 27,187 to 24,598.
United States dollar based investors segment their decision making many ways. One of the most popular is to first segment the allocation decision in a top down manner starting with stocks, bonds and cash. These classifications are many times also called equity, debt and cash. We will be using stocks, bonds and cash in this brief.
The two primary areas of concern for a fully invested portfolio are stocks and bonds and are segmented as such in this brief. Also in this brief, each of these areas is further segmented into subcategories. Within stocks, the decision to invest domestically only, or add international is a powerful force in determining additional diversification. Some investors feel more comfortable by staying with domestic investments.
One item to consider when making the domestic/international decision is to recognize that approximately 50% of all revenue of the largest corporations in the U.S. come from sales overseas. If you are a holder of the largest companies such as Apple, Google and IBM, much of their business success is internationally generated.
Within the U.S stock allocation the next segmentation is usually between large, mid and small capitalized stocks. This is followed by an allocation into specific sectors such as Consumer Discretionary or Energy. If international has been added segmentation amongst specific regions or individual countries is important.
Bonds also have similar segmentation decisions. The same consideration is given to domestic and international as well as deciding between government based bonds such as Treasury or Municipals. Segmentation can also be made between governments, corporations and mortgage backed securities.
All of these segmentations are discussed at each step in the forecast brief. We will start at the most comprehensive level and work our way down to each sub-segment within each asset classification. We will start with stocks.
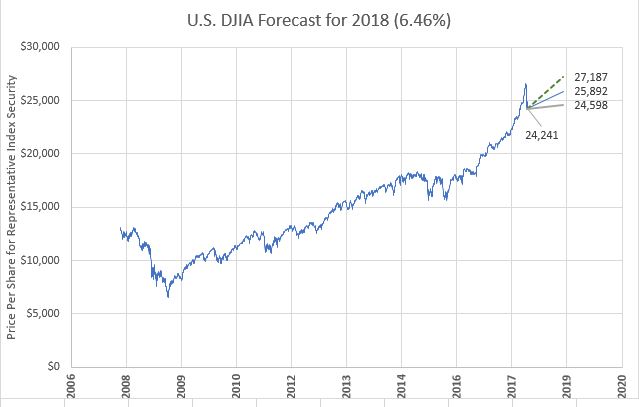 The history for each market segment we examine will always be in blue followed by three lines that represent the forecast. The top forecast line is a dotted green line representing a high expectation. There is a middle blue forecast line that represents a most likely extension of the history; it remains a solid line. Then there is a third dotted line colored red that represents the low expectation. Each of the three forecast lines has a numeric label that is the price/share of the representative index security. There is also a numeric value at the end of the history line and beginning of the forecast lines. The value at the end of the history line is the most recent close of the representative index security. This combination of numbers and lines gives you a visual and numeric view into the next 12 months. The growth rate that is used in calculating the most likely forecast is placed in the title bar. In the case of the DJIA, the growth rate is 6.46%.
The U.S. market can be viewed by looking at four market indicators. There are two largecap indicators, the S&P500 and DJIA, or what is commonly called the DOW, and a midcap indicator and smallcap indicator. Figure 1 shows the history of the DJIA and a forecast period.
We expect the DJIA to reach 25,892 by the end of 2018 and perform slightly below the long-term average. The S&P500 LargeCap index is displayed in Figure 2. 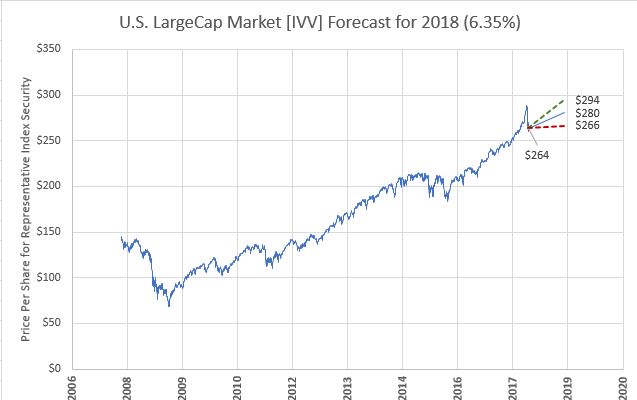 The annual growth rate for this segment, which is very similar statistically to the DJIA, is 6.35% and should reach a per share price of $280 for the IVV index security. The next most common level of segmentation is based on market capitalization, large, mid and smallcap. Largecap has been discussed with the DJIA and S&P500. The MidCap segment is best studied by using the S&P400 MidCap index. Figure 3 shows the history and forecast for the MidCap security identified as IJH.
 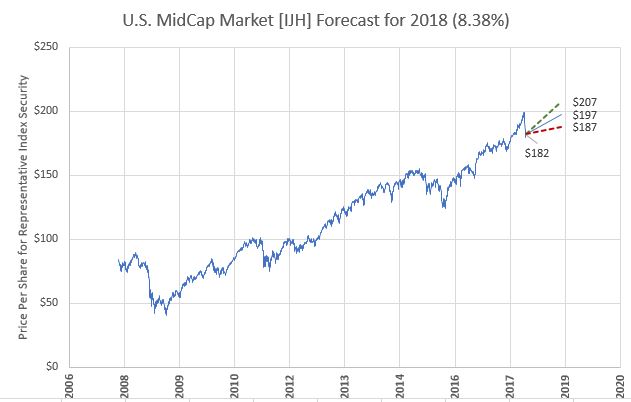 The growth rate for midcap stocks is expected to be higher than largecap and reach 8.38%. This is also lower than the long-term average for the segment and is primarily influenced by the relative valuation position of the segment. Currently, midcap stocks are at a 16.7% premium over fair value.
Smallcap stocks are expected to grow at 9.09% which is also below the long-term average due to current higher valuations. This is attributed to the high relative valuation of 114.2% Fv. Figure 4 shows the history and forecast for the smallcap index security.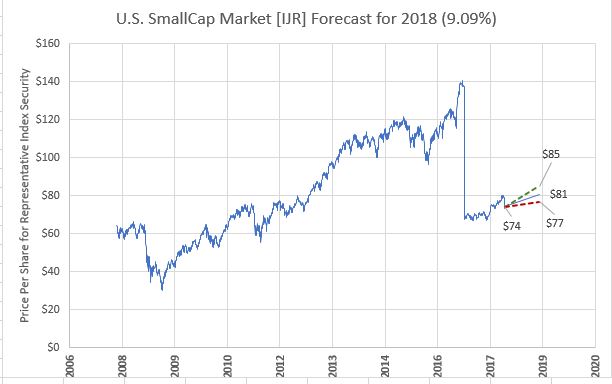
Before moving on to international markets we would like to take one more step down in segmentation and look at expected performance in the various sectors of the domestic (U.S.) market. There are ten sectors and each one has a representative index security.
Consumer Discretionary is the first sector and is displayed in Figure 5. We expect the sector to provide a return of 9.14% which is higher than the return for the security since inception, but slightly less than the last 10 years. This is primarily driven by the current relative valuation of 1.216% Fv.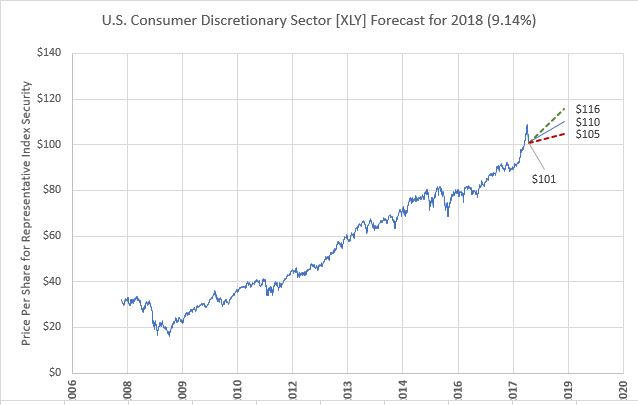
Consumer Staples segment is shown in Figure 6. We expect this sector to perform better than the market overall at 8.37%.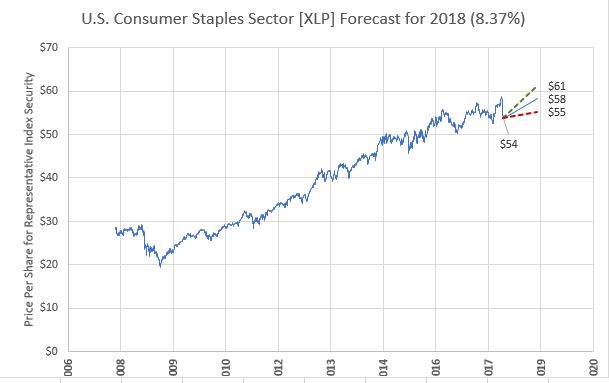
Energy has been the most difficult sector to analyze since the U.S. stepped back into the energy market as a major provider. It has been one of the most undervalued and as well overvalued sectors all within a 3-year period. Currently, we expect a 4.09% return for the sector which is higher than the last ten-year average, but only half as much as the index since inception. The sector is currently slightly overvalued.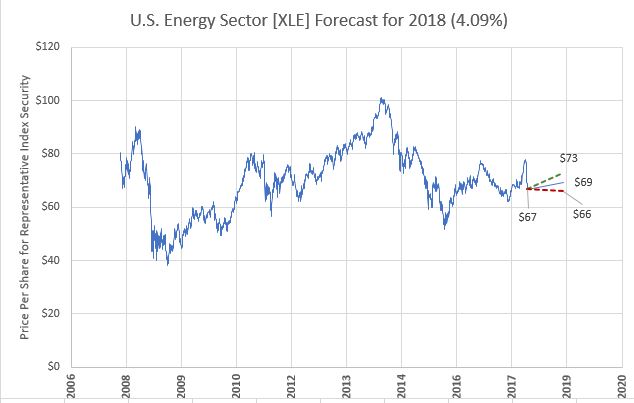
Sometimes it appears that the market expects more from Financials than can be realistically given. Ever since the Fed has indicated rates will be gradually increasing over the next 12 to 24 months, investors have been expecting a significant increase in returns from this sector. Reality is that the long-term average has been closer to 4.0% and well short of the larger market average for the same time period. We expect about an average return at 3.81% for the next year as competition accelerates. Branch closings have reached a new historical high for banks and rather than competing with other financial institutions, many simply blame regulation for the lack of competitive services. The industry will soon find itself in steep competition from around the country and not just the institution across the street.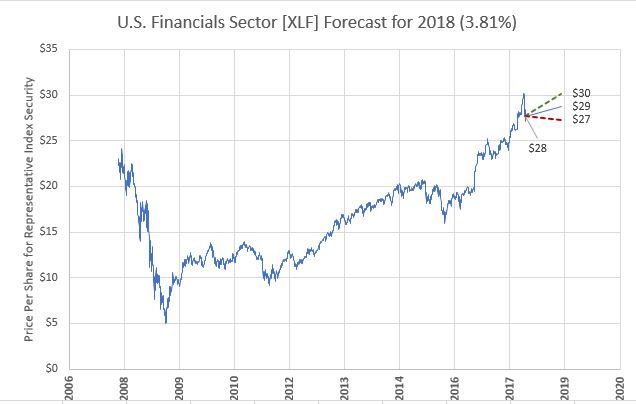
Health Care may experience one of the most unstable rides through 2018 with unexpected mergers from inside and outside of the sector. Figure 9 displays the history and forecast. We expect a growth of 9.15% for 2018.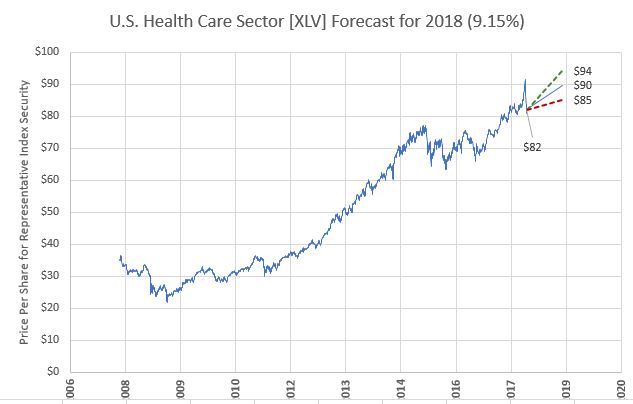
Industrials will be one of the better performing sectors gaining 8.02% in 2018. This will place it better than the overall market and in line with the sectors long term average.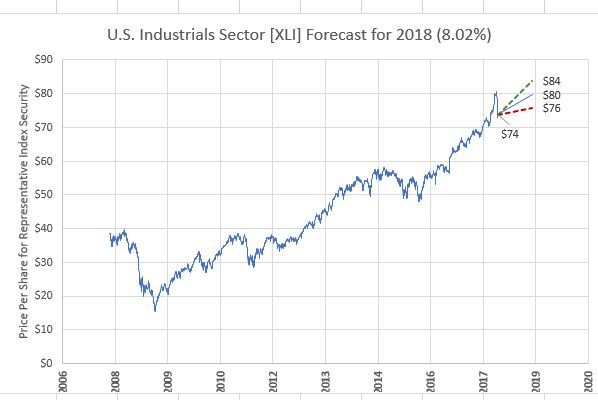
Expectations are high for Technology, almost too high. Competition is truly on a global basis and much of the recent gain (last 10 years) has been through the growth of smart devices and social media. Both smart devices and social media adoption rates are looking more like a mature industry rather than early adopters. Facebook is projecting a loss of over 2 million subscribers this year and Apple is finding it more difficult to get users to switch to a new high-priced smartphone. The lines at Apple stores when new products are announced are now measured in feet, not city blocks. One or two stocks do not make a sector, but it does influence the sector return when they are two of the largest companies in the world.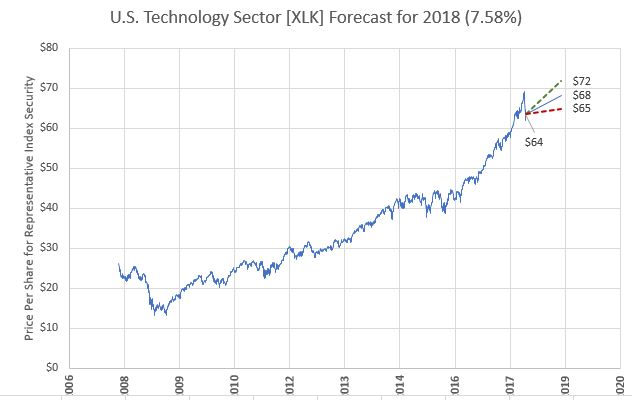
Materials is expected to be a winner in 2018 and perform better than the sector’s long-term average. Figure 12 shows a return of 6.99% which is in line with the market return, but slightly better than the long-term average.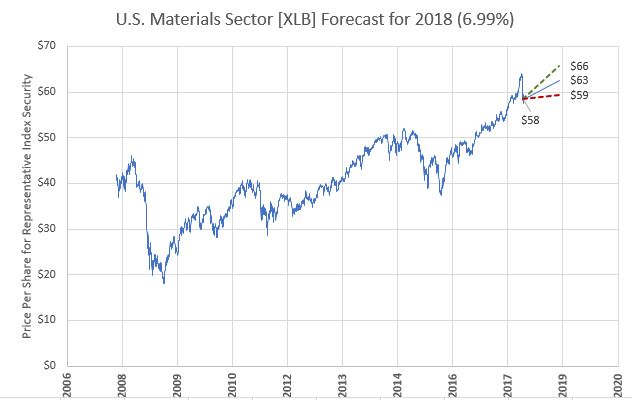
Telecom has struggled throughout 2017 and we expect the struggle to continue, but at least a positive number should be posted around 1.03%. It will be hard to distinguish the return from a bond return.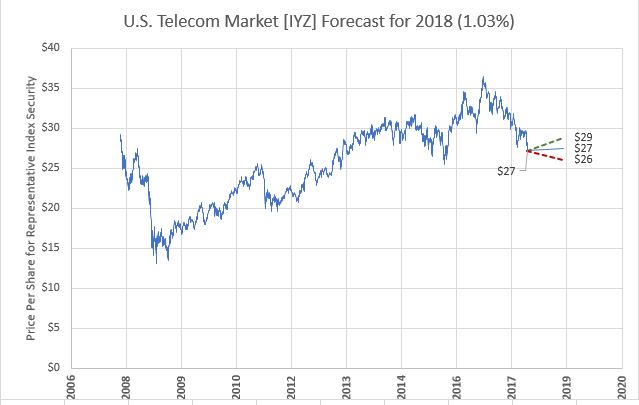
Utilities will experience an unsettling ride throughout 2018 as the sector probably experiences the brunt of interest rate increases and comparisons to bond investments. Figure 14 shows the history and forecast for the sector. A return of 6.50% should materialize, but it will not be a smooth ride getting to that point.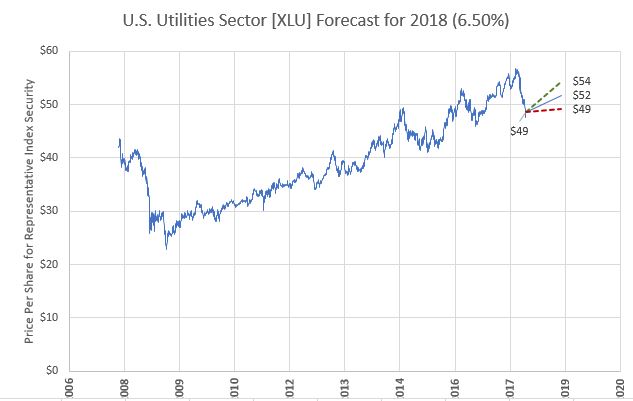
The last area in stocks takes us to international markets. In this segment we have divided the world into two major regions, developed and emerging, then into three regions and three separate countries. The three regions are: Europe, the Pacific without Japan and Africa which is represented by the South African stock index. The three individual countries are: United Kingdom, Japan and China.
Figure 15 displays the developed international markets as a group. We expect a 3.81% gain from international markets overall which is almost 2 percentage points above the long-term average for a USD based investor. This is much lower than what was experienced in 2017, but we believe a more normal market will materialize.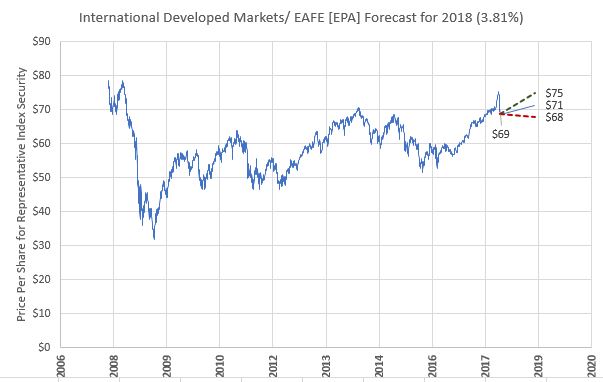
The other part of the international market, what is considered emerging markets is expected to grow at 6.71% in 2018 which is much stronger than the more recent 10-year average. Figure 16 shows the history and forecast for this segment.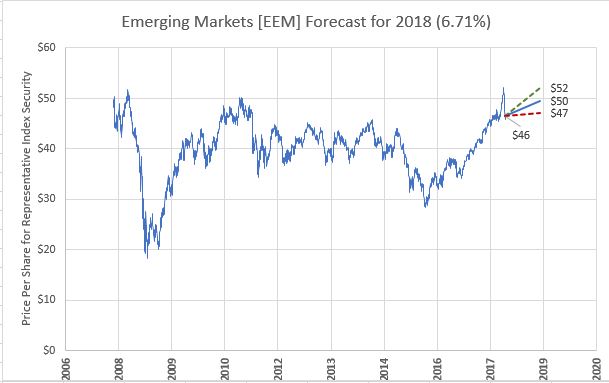
The three regions are shown in Figures 17, 18 and 19. Europe will enjoy less drama over Greek indebtedness and a much weaker German Euro finance influence. The coalition government recently adopted in Germany clearly is less forceful than previous administrations and France will be exerting greater influence in the German vacuum. We are not sure as to whether the French 35-hour work week will win out over the expected German 28 hour work week, but in any case, a lower productivity is certain. We do not believe a repeat of Chancellor Kohl’s productivity improvements are possible in a 28-hour week environment. Debt service will remain a restraint on infrastructure investment throughout Euroland.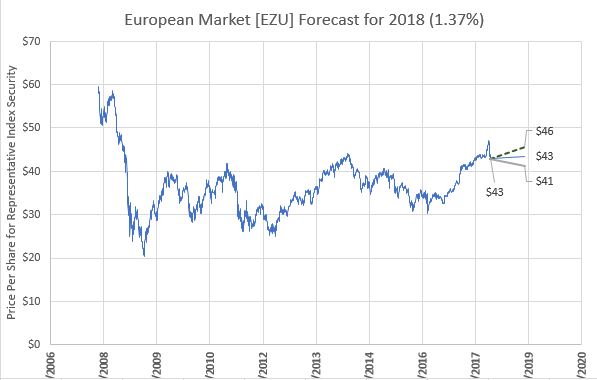
The Pacific region should enjoy a 7.03% return in 2018 placing it near the top of all markets. The history and forecast are displayed in Figure 16.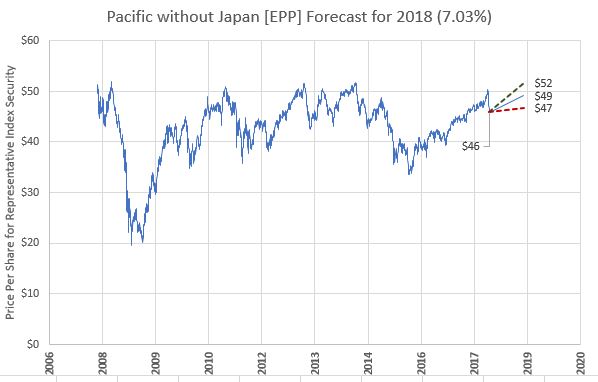
Africa is represented by the South African stock index as most African stock companies are represented on the exchange. We expect growth at a 7.98% level, which is higher than the past 10-year average, but under the long term average of over 12%. The confidence within this return number is lower than for other markets due to disruptions that are frequently caused by political events. However, even the Chinese have identified Africa as the next great market for low cost manufacturing.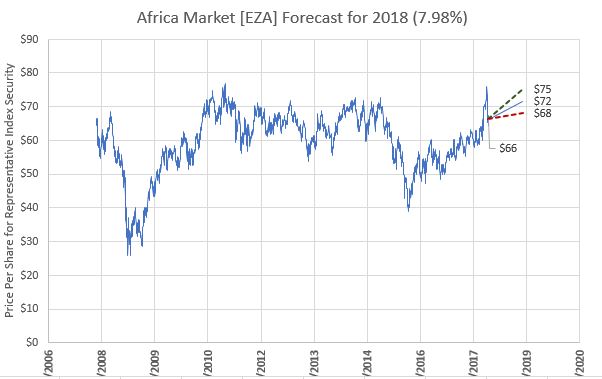
The U.K. is displayed in Figure 20 with an expected return of 3.33%. Brexit is not an insurmountable event, but it is a distraction that will cause uncertainty throughout the globe. This is important because it is easy for a truly international corporation to delay or prefer expansion outside of the U.K. until Brexit is sorted out. The uncertainty will reduce, but not severely damage growth for the short term. 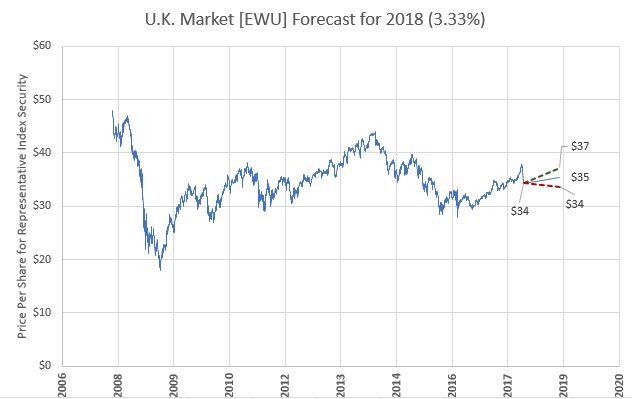
Japan has been enjoying a return to the spotlight recently and is a great study of how a country deals with long-term zero interest rates and aging population. Returns should be near 2.0% for 2018.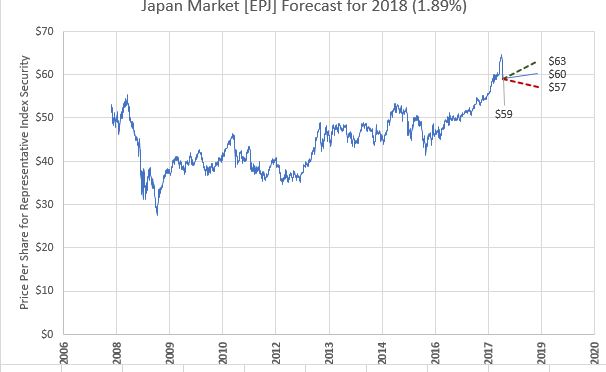 China is the last individual country we examine and it is expected to produce a return of 4.85%. This is certainly lower than the most recent period, but well above the past 10-year average. China has undoubtfully a large potential and will continue to advance in economic growth. We believe next year will see subdued returns relative to 2017.
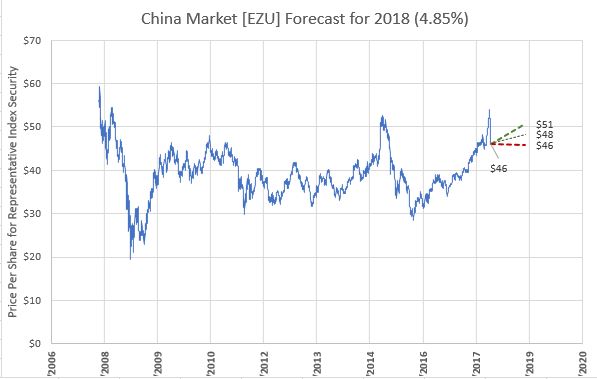
The bond market may experience more uncertainty in 2018 than during any time in history. We are entering a period of the unknown equal to the adventures of Captain Kirk and the starship Enterprise. If the Fed’s plan, along with the European Central Bank, are executed as expressed recently, a large part of the economic world will be moving out of accommodative economic conditions. This is unique since both have been in the world of zero rates and experimentation for a very long time. Central bank balance sheets are full of securities and debt not usually found in their vaults and the unwinding is about to begin. This will not be easy. There is no previous example or time in history that they can use as a learning experience. This will truly be new ground. There is plenty of theory. But, theory generally forgets about the unpredictability of human behavior. In theory, portfolio insurance worked.
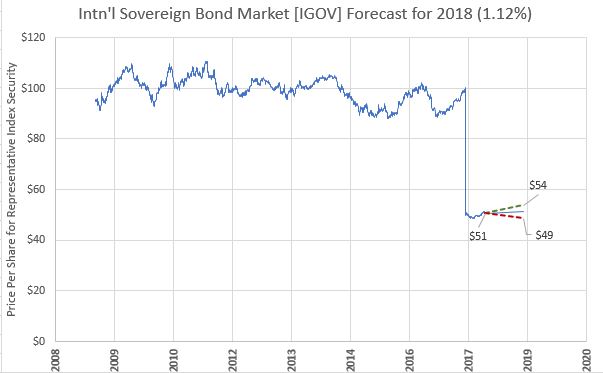
The Aggregate bond index is the most comprehensive benchmark for a USD investor. It includes nearly all the components of the bond market including some international. The aggregate security is displayed in Figure 22. We expect the overall bond market to provide a return very close to the long-term average at 3.96%. 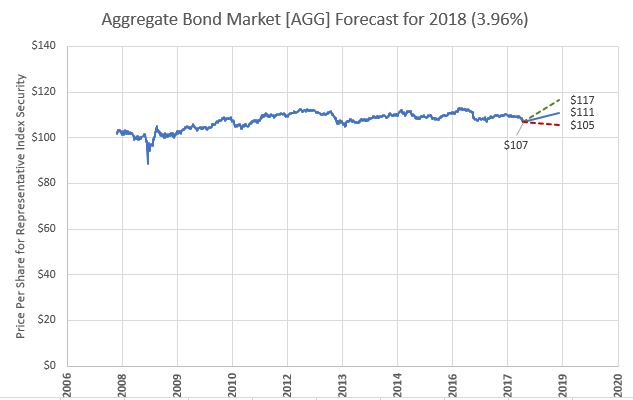 U.S. Treasury at 1 – 3 year will return around 1.6% and sovereign debt will be just behind that level at 1.12%. Both of these measures are displayed in Figures 24 and 25.
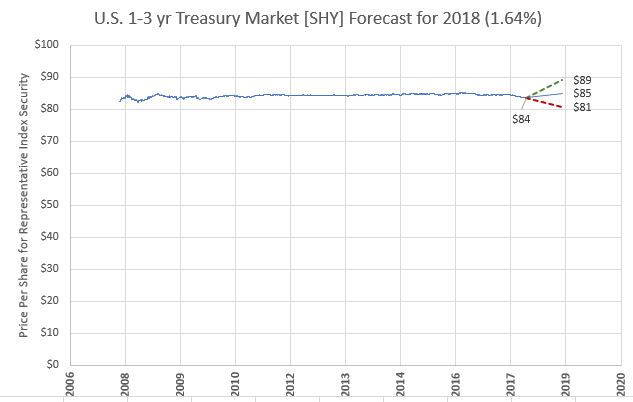
Mortgage Backed Securities should provide a higher return of around 3.5%.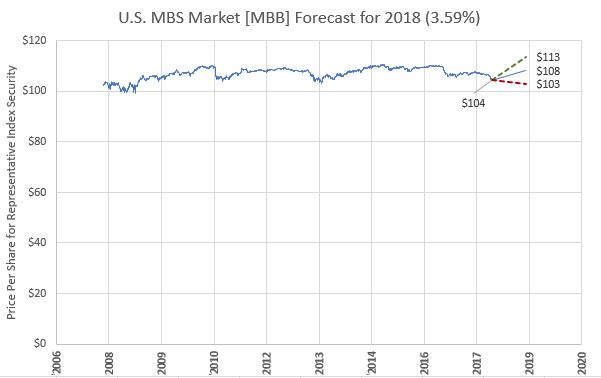
Municipals are expected to reach 4%, but we are getting increasingly uncomfortable with the constantly escalating debt loads and unwillingness for states and local governments to recognize a destiny to bankruptcy. Just because the statutes don’t provision for bankruptcy, does not mean that you cannot run out of money to pay the bond holders.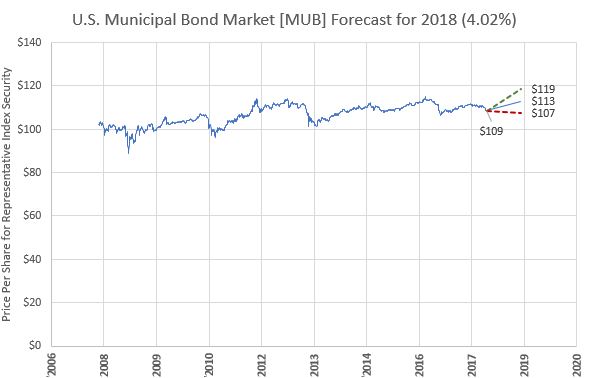
Many governments are treating their tax base as an unlimited source of funds. The municipal market may begin to fracture as interest rates rise and the cost to service debt correspondingly rises. Even though the municipal market is expected to generate 4% in 2018, it could potentially be short lived unless credit quality is carefully examined.
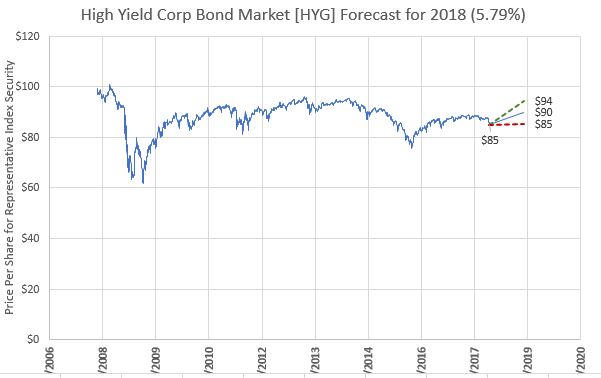
Corporate bonds, both investment grade and high yield should be able to return close to their long-term average of 5.75%. There may not be a large supply of high quality corporate bonds available as interest rates rise. Many corporations have already taken advantage of the current low rates and may find Boards and financial executives less interested in increasing their debt service expenses.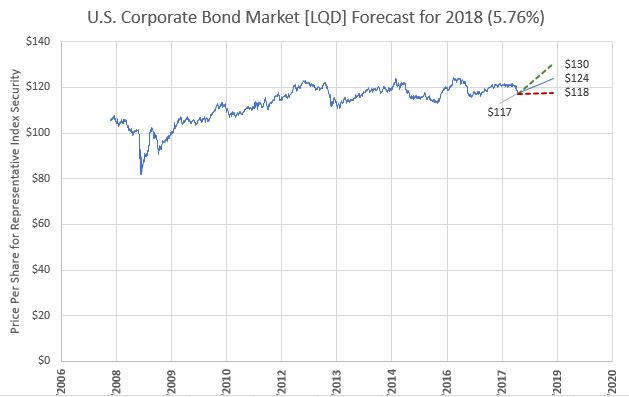
Behaviorists have been cautioning investors not to expect high quality corporate bonds to come to the market as rates start to move upward due to a higher sensitivity to debt service costs. It is hard to justify paying higher rates even if the rate is historically low.
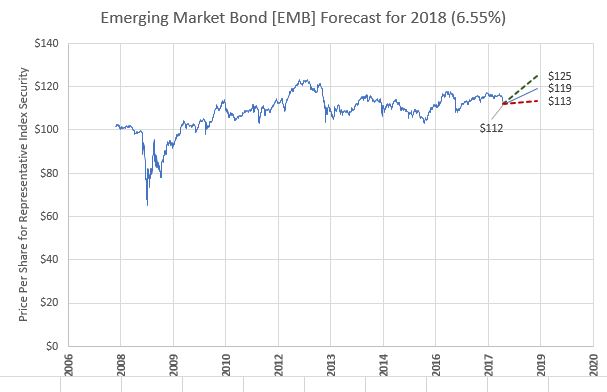
Figure 29 and 30 display two international segments, international corporate bonds and emerging market bonds. Both are subject to USD exposure to foreign currency movements. We expect international corporate bonds to gain by 3.07% and emerging debt to increase by 6.55%. emerging market debt can full of surprises and frequently subjected to political uncertainty and changes in currency valuations.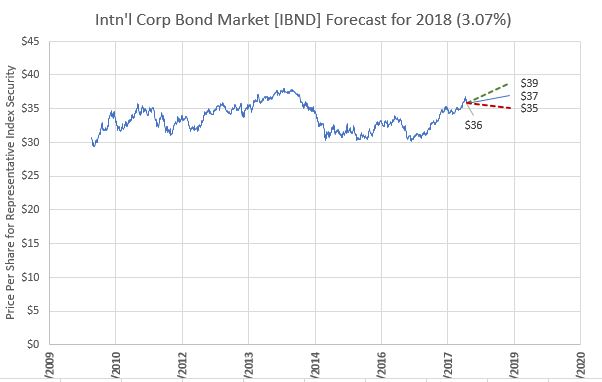
In general, we expect stock markets to adjust to good economic conditions, both domestically and internationally, along with gradual increasing interest rates. Inflation is expected to remain contained for the short term while central bankers attempt to be magicians and unwind their balance sheets without restraining economic growth. History is in the making, let’s hope that calm markets and opportunity remain the status quo.