China and Japan both advanced 1 percentage point in April. Financials advanced 1 point while Communications declined.
Rankings are segmented into several major categories designed to assist the investor in focusing on a global, regional, country, sector or individual stock. This report will provide insight on the world, regional, country and sector information. For complete details on the World-10 Billion individual stock ranking please reference the data on our site, www.investment-strategy.info. (MENU: Client Service > Rankings > World > World 10 Billion-Composite) The Rankings: World Markets – 10 Billion Report will be posted monthly. Mid-month postings may occur between monthly reports if there is a meaningful change in the overall ranking positions.
Rankings are derived using six fundamentally important factors that create a profile for each company. The profile is unique in that it can be used to rank a stock from any part of the world to any other stock. The six factors used to create the ranking are:
- Sales growth
- Earnings Per Share
- Dividend growth
- Price Earnings Ratio
- Yield
- Price Earnings Growth
Additional qualifying measures of data reliability are applied to the six factors. Sales growth, EPS and dividends reliability is measured over several time periods and applied to create a qualified sales growth, EPS and dividend growth value. The PEG factor is measured on a median basis rather than an average, avoiding heavily skewed ranking distortions.
Rankings are derived using six fundamentally important factors that create a profile for each company.
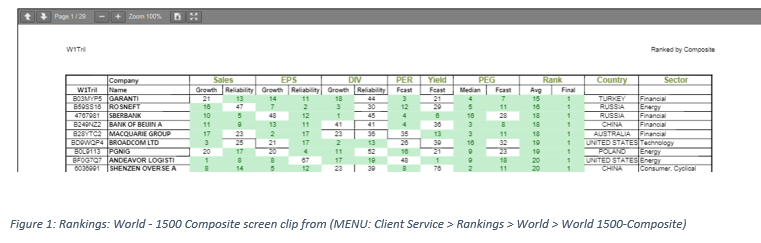
The six qualified factors are then used to determine an overall ranking and reported as the World 10 Billion. A sample of the ranking report is shown in Figure 1.
The complete list covers 1,500 stocks from around the world which includes 53 countries. The world composite and each country is also segmented into one of 10 sectors. Each country and sector is additionally segmented into ranking deciles.
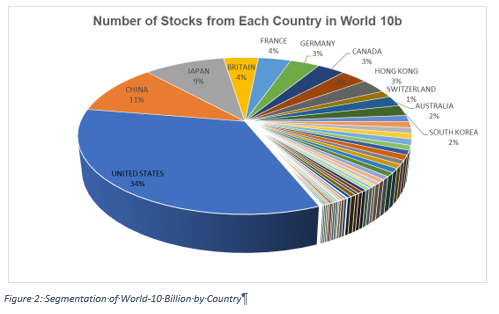
A distribution of the 1,500 stocks by country is provided in Figure 2. The size of each respective slice represents the percentage of stocks from each country within the group. All 53 countries are represented by a slice of the pie but, only a country that has more than 1% of the total has a label. The U.S. is the largest with 34% of the total followed by China at 11%. These are the two largest economies in the world and it is no surprise that they would secure the first two slots. Japan has moved to the #3 slot over the past 10 years and is now 2 percentage points behind China at 9%. The U.K. and France both have 4% with their European partner, Germany next at 3%. Canada and Hong Kong are equal with Germany at 3%.
Figure 2 is a segmentation of all stocks covered in the World-10 Billion. This group is ranked using the six factors mentioned earlier and then ranked from 1 to 100. The rankings fall into deciles. The first decile is the most desirous and the tenth decile, the least promising. Figure 3 is a country segmentation similar to Figure 2, but restricted to only stocks classified as 1st decile, the most promising.
Many of the country rankings remained in the same order, but several new names entered the picture. India, Russia, South Africa, Taiwan, Brazil, Mexico, Indonesia and UAE are present in the 1st Decile picture with greater than 1% of the total. Russia was the highest of the new arrivals at 4% with less than 1% of the total World-10 Billion, and South Africa represents 4% of the 1st decile stocks.
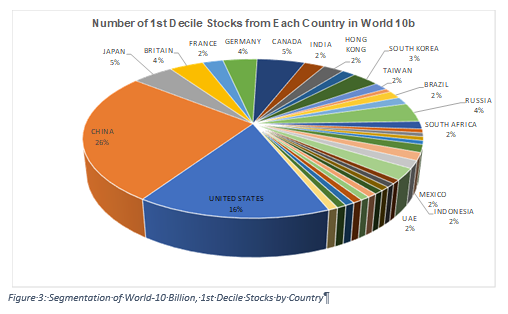
The U.S. and China retained their respective positions of #1 and #2, but the U.S. only has 16% of 1st decile stocks. However, China has secured 26% of the 1st decile positions with only 11% of the World-10 Billion.
Just as the U.S., Japan has 4 percentage points less in 1st decile stocks at 5%. Britain retained the same percentage weights in both 1st decile and overall segmentations. Canada stepped up 2 percentage point to 5%. Germany gained 1 point reaching 4% while France gave up 2 points falling to 2%.
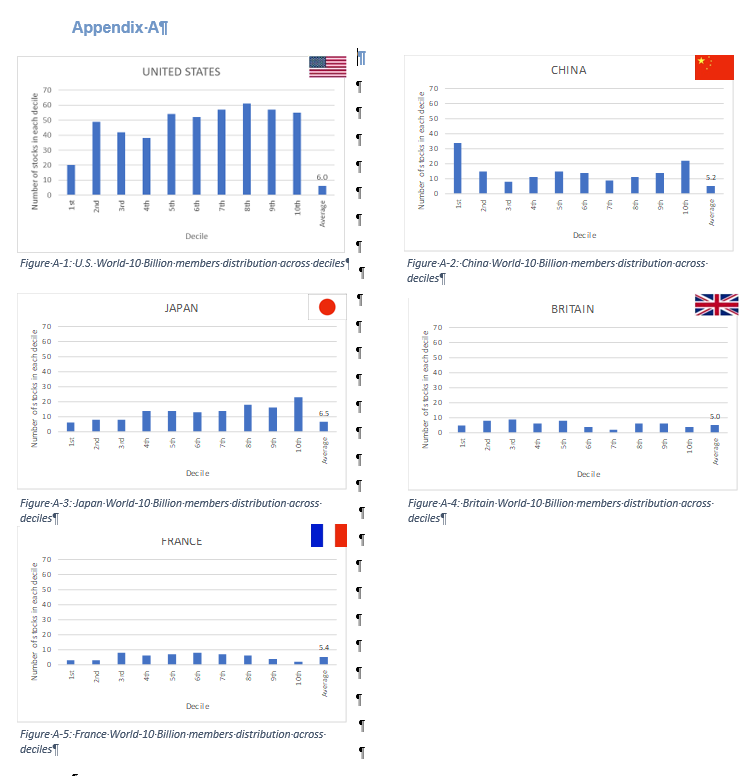
The Top 5 countries: U.S., China, Japan, Canada and Britain have very different distributions amongst the 10 deciles. Figures A-1 thru A-5 in Appendix A, show each of the individual countries and the respective distribution of stocks amongst the deciles.
When China is compared with the U.S. there is a clear visual picture of why the U.S. has a higher percentage in the overall group, but less of the 1st decile percentage. The stock distribution is skewed toward the deciles above 5th whereas China has a high percentage of the country within the 1st and 2nd decile.
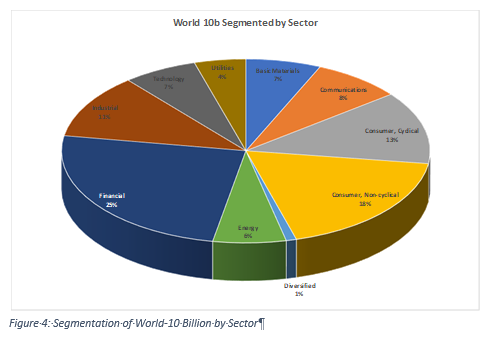
There are ten sectors that cover the global markets: Basic Materials, Communications, Consumer Cyclical, Consumer Non-cyclical, Diversified, Energy, Financial, Industrial, Technology and Utilities. Figure 4 is a pie chart showing the representation of each sector. Within the entire World-10 Billion universe, Financial is the largest sector at 25%. The next two largest sectors are both consumer related, Non-cyclical at 18% and Cyclical at 13% representing a combined 31%.
Financial stocks represent a higher percentage of the 1st decile and advanced 1 percentage point in April along with Consumer Cyclical.
At this point in time, within the 1st decile ranking, Financial stocks represent the dominate position at 44% followed by Consumer Cyclical at 11% (See Figure 5). Just as in the previous case of China and the U.S. on a country basis, Financial stocks represent a higher percentage of the 1st decile stocks than what they represent in the overall universe by a wide margin, 44% versus 25%, respectively. Industrials represent the other side, with an overall percentage of 11%, but only 9% of the 1st decile stocks.
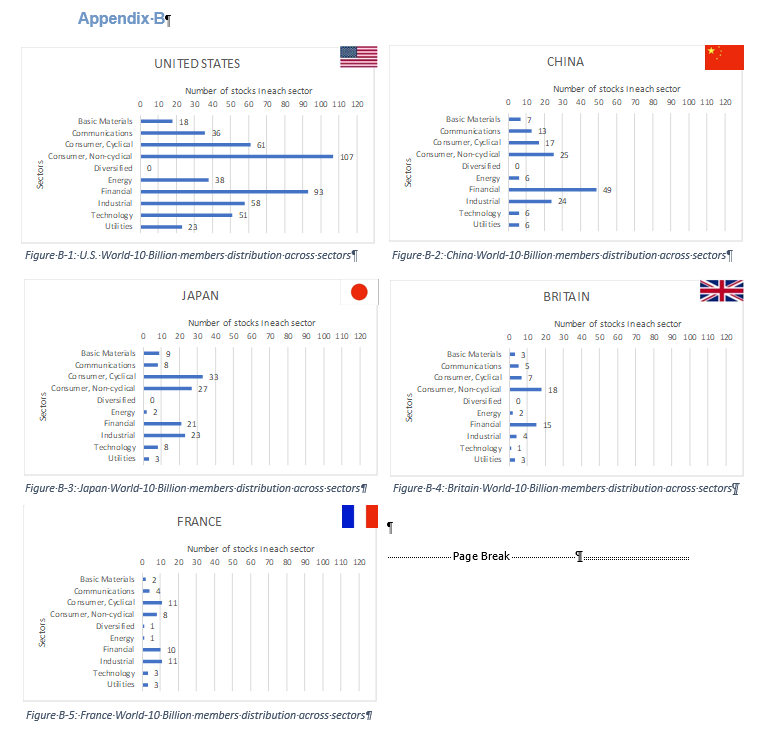
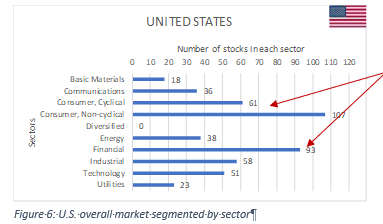
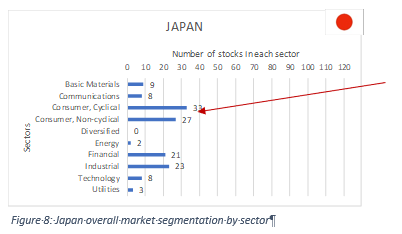
When markets are segmented by sector interesting differences appear. Every investor is most familiar with their home market. It may be dominated by financials, industrials or major energy companies. Investors need to be cautious that their home market does not cloud their perspective on world markets as international markets can many times open up diversification opportunities not available in an investor’s home market. In Figure 6,7 and 8 the Top 3, 1st decile markets are displayed detailing their sector distribution across the 10 sectors. The largest is the U.S. shown in Figure 6. It is clear there is wide diversification across sectors, but the country is dominated in Consumer and Financial sectors.
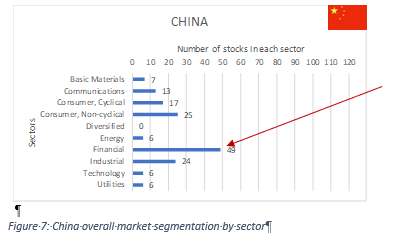
The number 2 market is China (Figure 7) and dominance is clearly in Financials followed by Industrials and Consumer related stocks. Energy, Technology and Utilities are less important in the overall picture in China when compared to the U.S., and it will be interesting to see how this changes over the next decade.
Japan is the third most important market and much different than either China or the U.S. in sector distribution.
Japan is the third most important market and much different than either China or the U.S. in sector distribution. Japan is clearly dominated by consumer related sectors with Industrials and Financials following. Basic Materials, Communications and Technology are all on about equal footing in the overall distribution. (See Figure 8)
The Top 10 markets are further segmented by sector in Appendix B, Figures B-1 thru B-5.
Over the years to come we will include changes in the patterns of inclusion within the World-10 Billion, the importance of specific countries and how sector composition changes as global markets change.
Appendix C, D and E are tables that identify stocks that have made noteworthy position changes in the month. Appendix C lists stocks that are appearing in the 1st decile for the first time. The table consists of the company name followed by the current decile position in brackets(x). Appendix D includes stocks that have made noteworthy advances in the decile ranking while Appendix E includes stocks that have not enjoyed the month and declined in their decile position.