
The Industrial Production Index (INDPRO) is an economic indicator that measures real output for all facilities located in the U.S. manufacturing, mining, electric and gas utilities. It also includes newspapers, periodical and book publishing. The index is available at the Federal Reserve Bank of St. Louis (FRED) monthly with a base year of 2012. For more on the index please refer to https://fred.stlouisfed.org/series/INDPRO/.
Many investors and economists place importance in the indicator because it has a tendency to demonstrate periods of coming inflation. If manufacturing is operating at near or full capacity, then there is a good chance prices will increase along with profitability; leading to a higher probability of future inflationary periods. Many investors are cautious in using the indicator because it only covers manufacturing which is less than half of the U.S. economy.
 Throughout the years investors have keyed on levels of industrial production in an attempt to identify directional changes in the stock market. We have all watched significant changes in the market attempted to be explained by a corresponding move in industrial production. “The market moved up because…”, or “The Market moved down because…” resonates, when markets move in one direction or the other, on the same day that industrial production numbers have been released. This explanation may be useful on a daily basis, or may be interesting to contemplate, but for longer period analysis it is less certain.
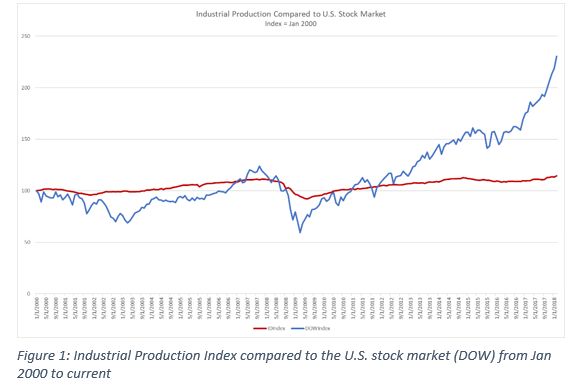
The chart in Figure 1 is a useful picture to visualize the relationship that exists between the general stock market and industrial production. It is clear industrial production has less variation than the market. The chart starts in January 2000 just as the market started to realize dot.com speculation was overvalued. Industrial production had been on the rise until 2001 when the market decided it was better that enterprises be profitable, today, and not some unknown date in the future. Industrial production dropped along with the market, but it does not appear to be as severe as the market correction.
Moving into the period from mid-2003 to September 2007, industrial production started to gain value and the market seemed to follow, but again at a lower level. Then the Mortgage Crisis damaged markets globally and the single largest downward move in industrial production also occurred. Again, not as severe as the market change, but certainly in the same direction.
This pattern of similar direction, but subdued magnitude, repeated again throughout 2009 and 2015, and again from 2016 to the current time. There appears to be a reliable relationship between the two variables, but the degree of the relationship appears to be uncertain.
Building on the premise that a relation exists we can examine the changes of both variables, both up and down, over time, and take into consideration the degree of change by each variable. When we move beyond the graphic representation and look at the magnitude of the changes, a relationship becomes more interesting. Figure 2 shows the relationship between the market and industrial production when we adjust for the magnitude of the changes. Industrial production changes are smaller than changes in the market. But, if we adjust for the difference in magnitude, can we see a meaningful relationship?
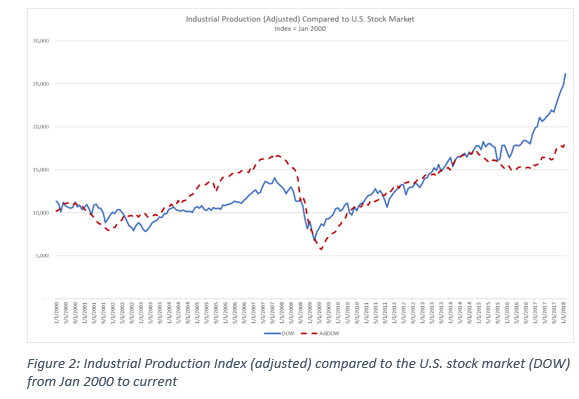 There are four periods of interest. Between 2000 and 2004, the two variables, the market and adjusted industrial production, follow each other very closely both up and down. Through 2003 and up until early 2007 both variables moved in the same direction, but industrial production appears to have been able to support a stronger market. As the two variables moved further apart, the variables relationship adjusted (corrected) and came back together dropping together until mid-2009.
For the next 6 years both variables moved closely together, just as they had in the pre-2002 period. Then the variables began to move in the same direction, but at different rates. The market started moving well ahead of what growth in industrial production could possibly support. Even at the current level of 24,000 – 23,000 on the DOW, the market is ahead of what an industrial production level can support.
This does not translate to a must occur correction. Industrial production reports on less than ½ of the U.S. economy. There are numerous areas of the market, such as services, that can continue to support a higher market. It is interesting to notice that growth in industrial production does support a higher market than pre-2016, but areas of the economy are needed to reach higher levels.
At the general market level, we know that a relationship exists and behaves the best when industrial production and the market move in close relationship with one another. There is potential for market disruption when the two variables move apart, or at different rates over several years. This gives a Moderate relationship between the two factors.
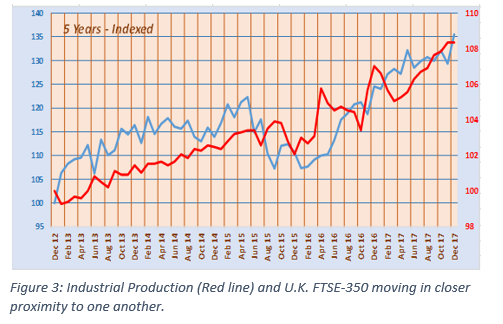
Looking around the world at the relationship between industrial production and stock markets, we see that the U.K. has a similar association between the two factors. Currently, industrial production is much closer to current market conditions than what the U.S. is experiencing.
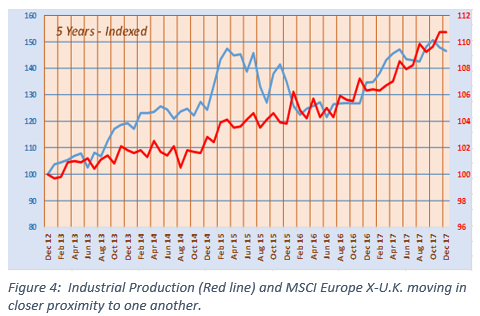
 Continental European stock markets also have a close relationship with industrial production, the market moved ahead of the market and returned in 2015. Currently, industrial production is slightly ahead of stock market gains.
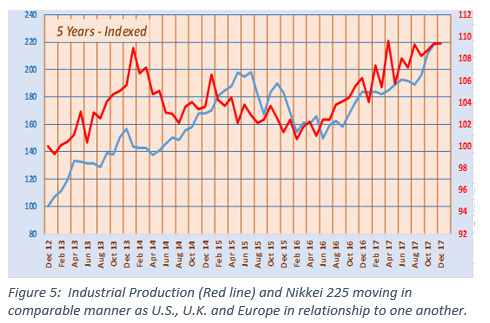
 Japan has a similar relationship between the Nikkei 225 and industrial production since early 2016. However, before that time industrial production contracted after a peak in late 2013 through early 2016 while the market continued to improve until the summer of 2015. Then the two factors moved back in sync.
 There are strong relationships between specific individual securities and industrial production for just over ¼ of the market. The sectors with the most, Very Strong and Strong relationships are: Utilities with 43%, Industrials at 40%, Financials and Materials with just over 30%. The least related to industrial production is Telecom at 8%.
| Relationship Category |
Number of Stocks |
Percentage |
| Very Strong | 59 | 3.9 |
| Strong | 333 | 22.2 |
| Moderate | 462 | 30.8 |
| Uncertain | 622 | 41.4 |
| Inverse | 26 | 1.7 |
Table 1: Number and percentage of stocks according to relationship category.
Industrials’ relationship is logical and expected. Utilities do well when industrial production is up because energy demand is higher, and a Utility is the most direct in line to benefit from higher industrial energy demand. The energy sector might come to mind, but it is impacted by raw material costs, the mix of raw material usage (crude, natural gas, coal) and immediate market price fluctuations. Utilities charge and generate revenue on a more stable basis due to higher regulatory oversight which does not allow fee rate fluctuation in immediate response to supply and demand changes. Higher demand from industrials can be beneficial to utilities due to less elasticity in the supply/demand pricing curve.
Materials companies appear to have a logical relationship with industrial production and Financials reasonably benefit, or get hurt, when industrial production moves up demonstrating a growing economy, and falls when the industrial economy slows. Financing and cash flow is a critical component to success in industrial production.
Within the sectors that have a strong relationship with industrial production we have listed the Top 10 stocks for each sector. The industrial stocks with a Very Strong or Strong relationship with industrial production are shown in Table 2.
| Stock Ticker | Company Name |
| FWRD | Forward Air |
| GBX | Greenbrier Cos |
| TXT | Textron |
| TRN | Trinity Indus |
| MSA | MSA Safety |
| FELE | Franklin Electric |
| UPS | United Parcel Service |
| TILE | Interface |
| R | Ryder System |
| TBI | True Blue |
Table 2: Top 10 industrial stocks with a Very Strong or Strong relationship.
Top 10 utility stocks with a Very Strong or Strong relationship with industrial production are shown in Table 3.
| Stock Ticker | Company Name |
| EIX | Edison Intn’l |
| ALE | Allete |
| PNM | PNM Resources |
| D | Dominion Energy |
| SRE | Sempra Energy |
| NEW | NorthWestern |
| WTR | Aqua America |
| PEG | Public Service Enterp |
| EE | El Pasco Electric |
| HE | Hawaiian Electric |
Table 3: Top 10 utility stocks with a Very Strong or Strong relationship.
Top 10 materials sector stocks with a Very Strong or Strong relationship with industrial production are shown in Table 4.
| Stock Ticker | Company Name |
| MYE | Myers Industries |
| NP | Neenah Paper |
| EXP | Eagle Materials |
| SON | Sonoco Products |
| ASH | Ashland |
| FUL | H B Fuller |
| CRS | Carpenter Tech |
| DWDP | DowDuPont |
| MTX | Minerals Tech |
| SHLM | A Schulman |
Table 4: Top 10 materials stocks with a Very Strong or Strong relationship.
For more information on how a specific stock is influence by industrial production please see the respective stock’s data sheet via the Stock Search menu at www.Investment-Strategy.info.